Introduction
Our on-chain analysis covers critical metrics of the cryptocurrency market during the first half of 2023. We meticulously collected data from Glassnode and analyzed it with the assistance of the esteemed DIFX Research team. Our expert analysis focused on Bitcoin, Ethereum, Defi, and Stablecoins, evaluating various metrics such as Address Growth, Futures Markets, Exchange Volumes, and Total Value Locked.
We have provided our insights into the outstanding performance of these top assets in the industry. Amidst the current crossroads in the crypto market, we are confident that the global economy is gradually gaining control over inflation and the shift in sentiment as major central banks adopt a more dovish monetary policy which will pave the way for the upcoming bull market. Our report highlights on-chain metrics that investors should familiarize themselves with to prepare for the anticipated bullish trend.
Bitcoin
Address Growth
Bitcoin addresses are identifiers which allow users to store and transfer Bitcoin. They serve a similar purpose to that of a “wallet” and act as the destination or source of transactions within the Bitcoin ecosystem. Addresses with a non-zero balance indicate that the wallet has not only been created but used to purchase or hold a digital asset. This is a key metric as it tracks Bitcoin addresses which have had some sort of activity.
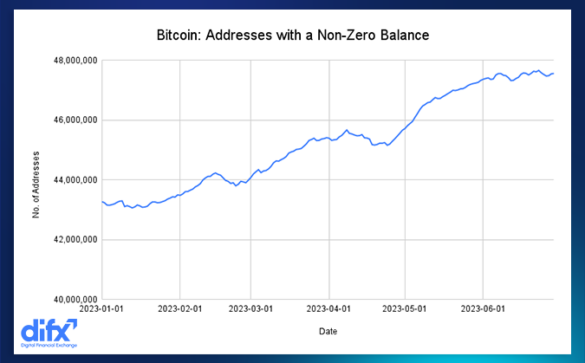
We can see from the chart there has been significant growth for non-zero Bitcoin addresses as the figure at the start of the year was 43 million and has now grown to over 47 million. This shares a correlation with Bitcoins price which gained over 80% in the same timeframe. We notice there is a dip in Bitcoin addresses during February and if we look at Bitcoins price around the same time period, Bitcoin’s price fell from around $25,000 to $19,000. Investors can keep an eye on Bitcoin address growth to forecast future price movements in the overall crypto market.
Perpetual Futures
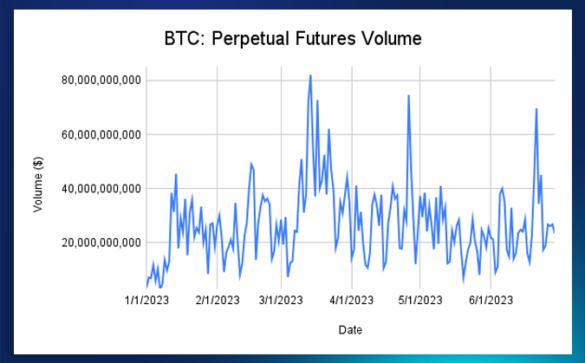
Perpetual futures are futures with no expiry date which means there is no physical delivery of the good and it is purely speculation on price. The Bitcoin perpetual futures market is where we see the largest volumes due to institutional trading. Volume within the perpetual futures market is a key indicator for sentiment as this signals to what extent large funds are actively trading the digital asset. At the start of the year the trading volume stood at $3bn but has since seen a steady increase through Q1 and Q2. In March, trading volumes ballooned to $80bn which shares a direct relationship with Bitcoins price movement for March when the asset rose 51% from March 11th – March 24th.
Exchange Netflows
The chart above gives investors an idea of the net transfer volume of Bitcoin. In this case, a positive figure represents incoming BTC transfers into an exchange and a negative figure would be outgoing transfers of BTC from an exchange. Glassnode gathers data from these exchanges; Binance, Bitfinex, Bithumb, BitMEX, Bitstamp, Bittrex, Bybit, Coinbase, Coincheck, crypto.com, Deribit, FTX, Gate.io, Gemini, HitBTC, Huobi, Kraken, KuCoin, Luno, OKX and Poloniex.
We can see from the chart that the data is skewed slightly to positive inflows except for the outlier in May. This tells us that for the majority of the first 6 months in 2023 we saw more BTC flowing into exchanges as sentiment turned positive with Bitcoin going on a bull run to cross $30,000.
Bitcoin Summary
Address Growth on the Bitcoin network over the first 6 months of the year gives investors signs of adoption. 4 million new non-zero wallets have interacted with the Bitcoin network in that time period and these figures give us a sense that the space is beginning to see renewed positive sentiment. Bitcoin Perpetual Futures has been a key metric for investors in the past as it signals institutional adoption. At the moment we are seeing a steady incline on the trading volumes even if we disregard the outliers with substantial increases in volume. This is indicative of the market sensing a potential bull run as investors begin to increase positions in the futures market.
After analyzing the Exchange Netflows chart we can see a clear correlation between inflows and price action for Bitcoin. During March we saw massive amounts of Bitcoin flowing into exchanges with netflows reaching between 10,000 BTC and 14,000 BTC. During the same period Bitcoin experienced a rapid gain of 45% to $28,000. Investors can use this metric to forecast future Bitcoin momentum. If investors keep an eye on Perpetual Futures volumes as well as Exchange Netflows, this will give them more insight to build intelligent investment strategies when looking to deploy capital into Bitcoin.
Ethereum
Daily New Addresses
This chart displays the amount of new addresses which have appeared, for the first time, in a transaction of Eth on the Ethereum network. This is a clear indication of growth in the Ethereum ecosystem. New user addresses engaging in transactions within the network expresses to an investor that an increasing amount of development and further adoption is currently taking place.
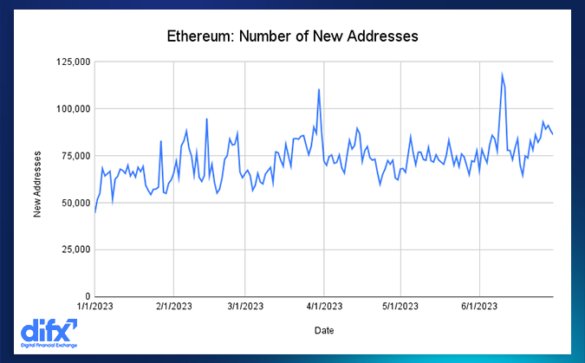
Ethereum is the largest Layer-1 protocol and to see the number of new addresses rise over the first half of 2023 tells us that new users are being introduced and becoming active on the network. This data tracks users which are involved in the NFT space, using Dapps or engaging in the Defi ecosystem on Ethereum. The number of daily new addresses at the start of the year was 44,000 and during the second quarter we saw growth to 117,000 new addresses taking part in a transaction on Ethereum.
Daily Active Addresses
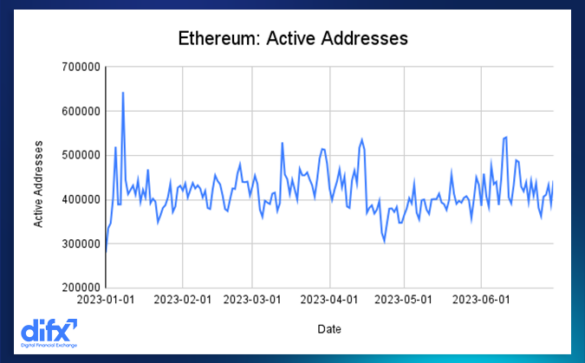
The chart above shows the number of daily unique addresses that were active on the Ethereum network which includes both a sender or receiver. This indicates that retail users are making use of the protocol in some way or another. If this number is high this means that more Ethereum wallets had some movement on that day which usually has a solid correlation with Ethereum price. On January 1st the amount of active addresses was 279,000, since then this metric has only fallen beneath 300,000 on one other occasion.
We have seen multiple days where the daily active wallets breached over 500,000. As this chart begins to trend higher it will signal bullish momentum for Ethereum. This also provides investors with a view on the overall development and innovation within the Ethereum ecosystem as this metric includes activity which can range from Defi, Blockchain Gaming, NFT Trading and other Dapps on the protocol.
Total Value Locked – Defi
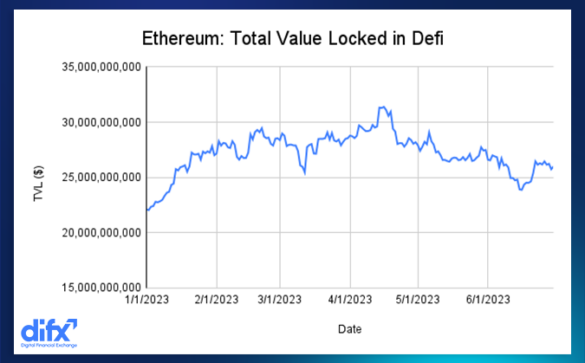
Total Value Locked (TVL) is the volume of assets which are locked up in Defi projects. This chart displays the total amount of TVL in Defi on the Ethereum network. This includes staking protocols and gives the investor an idea on how strong the foundation is for a particular token. Total Value Locked is one of the key metrics to evaluate how an asset is performing because it signals commitment from the community and most importantly, how liquid a certain project is. The more Total Value Locked. the more liquidity on the protocol.
TVL on the Ethereum network started the year off at around $22 billion which is still a significant amount. We then saw the metric rise to over $30 billion as investors seemed to deploy more cash into Defi over the course of Q1. Interestingly we have seen a dip in TVL through Q2 as figures slide down to $25 billion. Defi peaked in 2021 with around $100 billion in Total Value Locked and at the same time Ethereum hit an ATH just over $4800. If Defi can find some momentum then this will drive Ethereum prices higher as the native token on the network.
Ethereum Summary
Ethereum holds the attributes of a solid network with activity and volumes in all areas. As the crypto market begins to set its sights on a bull-run, we can clearly see new users, activity and volumes trend in a positive direction. Unlike other layer-1 protocols, Ethereum remains solid through a bear market as foundations have been built with years of development. Investors can keep an eye on TVL metrics if they are engaged in the Defi sector as this will provide signals to changes in sentiment. In terms of adoption, daily new addresses and active addresses have grown on average throughout the year and investors of Ethereum can use this metric as a measure of actual utility being created and used by the Ethereum community.
Stablecoins
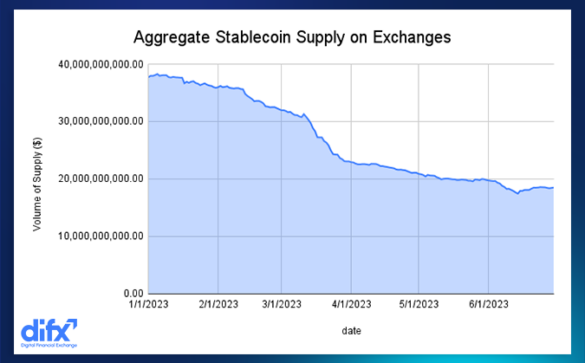
This chart shows the aggregate amount of stablecoin supply across multiple blockchains. The data has taken into consideration USDT, BUSD, USDC, DAI and TUSD. Essentially this is the total volume of these assets which are held on exchanges and is a great indicator for stability of the entire stablecoin market.
We have seen stablecoin volumes lose a massive amount of volume over the first half of the year, particularly in Q1 when the volume fell from $38bn to $23bn shedding around $15bn in supplies. Since the start of Q2 stablecoin supply has moved relatively flat sitting just under $20bn for the most part. We may have seen this sharp decline at the start of 2023 due to investors selling out of stablecoins and buying into Bitcoin and Ethereum.
It is common practice for retail traders to hold a portion of their portfolio in stablecoins through bear markets to hedge any risks but as we have seen crypto revive itself this may have also had a downside impact on the stablecoin market. Moving forward it will be interesting to see how the stablecoin market reacts when Bitcoin moves into the next range closer to $40,000.
Final Thoughts
The first half of the year has shown a significant resurgence in the key areas of the crypto market with Bitcoin and Ethereum exhibiting healthy attributes. There has been growth as opposed to the decline throughout the 2022 bear market as we have experienced growth in terms of volumes and new users begin to adopt the technology.
Bitcoin perpetual futures should be watched closely as this may act as a signal with its close correlation to price action for BTC. As institutions and large hedge funds begin to trade Bitcoin with leverage, this has a clear effect on Bitcoin’s price. The risk from this is the cascading liquidations that can take place during a bear market. Will we see traders become more careful and risk-averse with their leveraged positions for the next bull run?
Ethereum on-chain activity is picking up and has a direct relationship with Eth price as we have seen new addresses grow with price action. The asset is a long way from all-time highs but the community is strong and core development has continued throughout the bear market which only strengthens the infrastructure holding it together.
Defi is a solid sector for the ecosystem and even though it is far from its highs of 2021, it has managed to hold onto a substantial amount of volumes, which can only mean real utility is being used and being developed within the space.
Disclaimer
All materials, ideas, and concepts are the property of Digital Financial Exchange (DIFX) and are protected by copyright and other applicable law. The exchange or participation in the platform is not subject to any advice included in this document, nor does any information or analysis contained herein represent an investment decision. Prospective users need to be fully aware of the risks associated with it.
By investing, the investor acknowledges and accepts the risks of the project. Regulations about fundraising for blockchain projects and digital tokens in some countries remain unclear, which may lead to losses for participants due to legal or policy changes. Independent investors are solely responsible for any associated risks and must assume responsibility for any resulting effects or repercussions. Risks related to laws, regulations, compliance, economic cycle, cybercrime, management, the expansion of the digital asset market, price volatility, and other factors not listed. You are hereby warned that this document or any other material presented by DIFX is not created as a promise to make any profits