
Too busy to stay updated on the markets? We are here to give you a quick glimpse on what’s happening in the crypto and traditional markets. Tune into our weekly DIFX Trading Analysis and Insights to optimize your trading strategies.
The week we are looking at the following assets:
US Dollar Index (DXY)
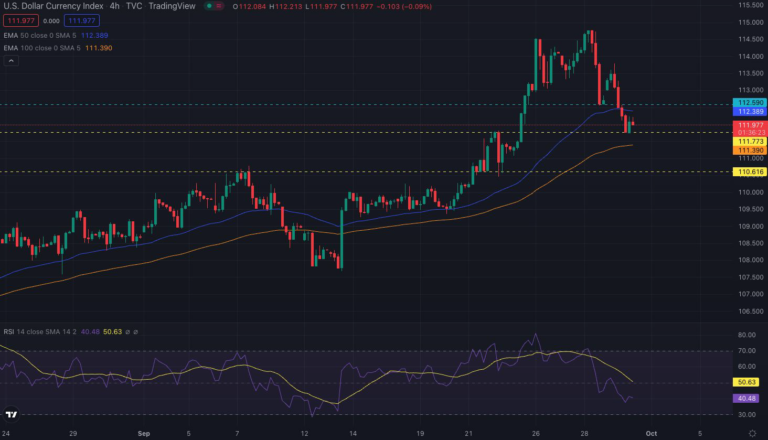
DXY is going through a bearish selloff. The index has found support at $111.7. We expect a slight rebound at this level, about 50 pips to $112.2.
The first resistance to look out for is around $112.5. After this level, $110.6 seems to be the next support.
- Market Sentiment: Bearish
- First Resistance: $112.5
- First Support: $110.6
US Dollar/Japanese Yen (USD/JPY)
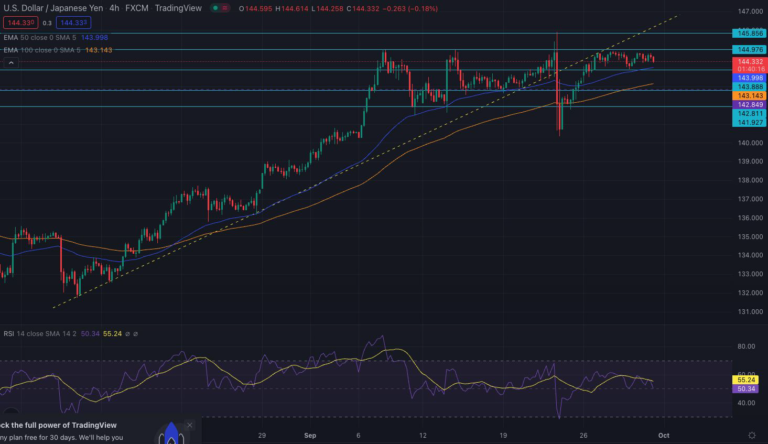
USD/JPY is trading around $145-$144. The pair is not following a certain direction at the moment.
The buyers are looking out for any intervention from Bank of Japan. However, the dollar is more bullish than the Yen fundamentally.
As price action squeezes, we may see a breakout either way.
- Market Sentiment: Sideways
British Pound/US Dollar (GBP/USD)
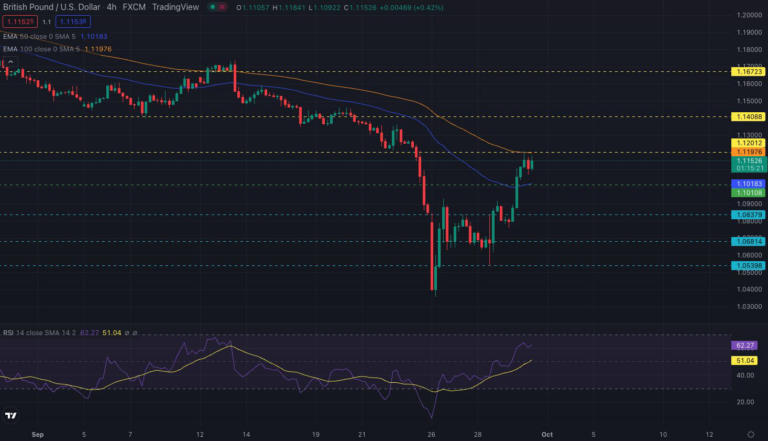
Here, we can see support and resistance lines that traders can follow as GBP/USD volatility continues. We have just seen a rally of over 400 pips by cable.
A retracement to $1.10 seems likely before a continuation in the bull run. Markets have started to correct after the rapid decline to an All Time Low.
- Market Sentiment: Bullish
- First Support: $1.10
- First Resistance: $1.12
Euro/US Dollar (EUR/USD)
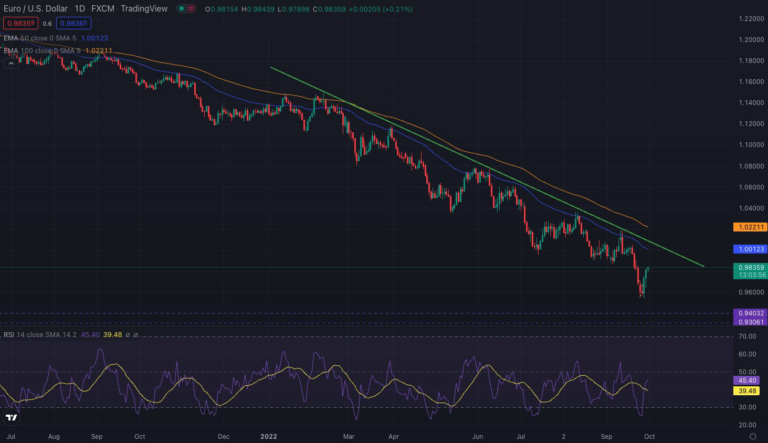
EUR/USD is on a steady downtrend. Traders should be patient and wait for the trend line to be tested which can be a great entry for short sellers.
We can also pay close attention to the 50-day EMA on the daily chart to enter a short position.
Market Sentiment: Bearish
Bitcoin/US Dollar (BTC/USD)
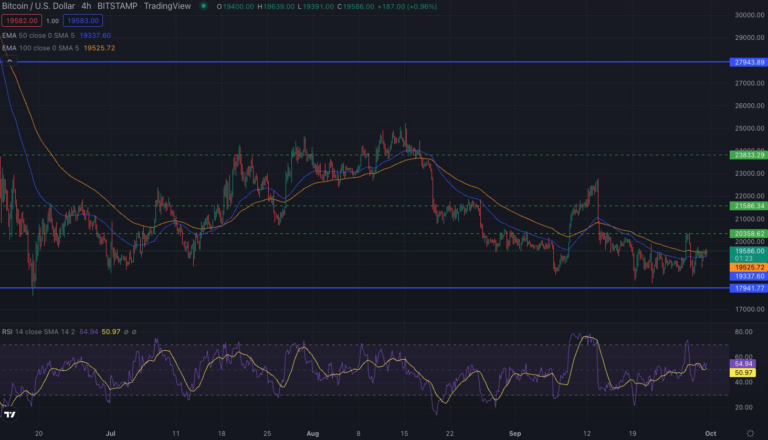
Bitcoin/US Dollar 4-Hour chart is eyeing up a bull run. We may see a move for $20,300. This level was tested before and rejected, however, the market failed to price in a new 7-day low.
RSI has been gaining momentum during this period. Traders can pay attention to the resistance lines on the chart to close long positions.
- Market Sentiment: Bullish
- First Resistance: $20,358
- Second Resistance: $21,586
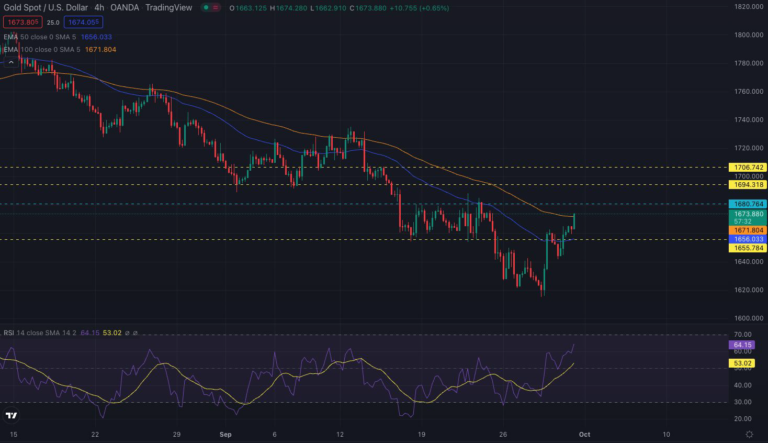
Gold/US Dollar (XAU/USD)
Gold has broken the resistance at $1668 and is eyeing $1680. Traders can decide their next move based on the reaction at $1680.
On the technical side, we are beginning to see a reversal to the upside in the market. You can see short-term entries/exits for long positions on the chart.
- Market Sentiment: Bullish
- First Resistance: $1680
Crypto products are unregulated and could be highly volatile. Please be aware of the risks before investing.
DIFX shall not be responsible for any loss arising from any investment based on any recommendation, forecast or other information herein contained. The contents of this publication should not be construed as an express or implied promise, guarantee, or implication by DIFX that the forecast information will eventuate, that clients will profit from the strategies herein or that losses in connection therewith can or will be limited. Trades in accordance with the recommendations in an analysis, especially leveraged investments such as foreign exchange trading and investment in derivatives, can be very speculative and may result in losses in particular if the conditions or assumptions used for the forecast or mentioned in the analysis do not eventuate as anticipated and the forecast is not realized.