Too busy to stay updated on the markets? We are here to give you a quick glimpse on what’s happening in the crypto and traditional markets. Tune into our weekly DIFX Trading Analysis and Insights to optimize your trading strategies.
GBP BREAKDOWN
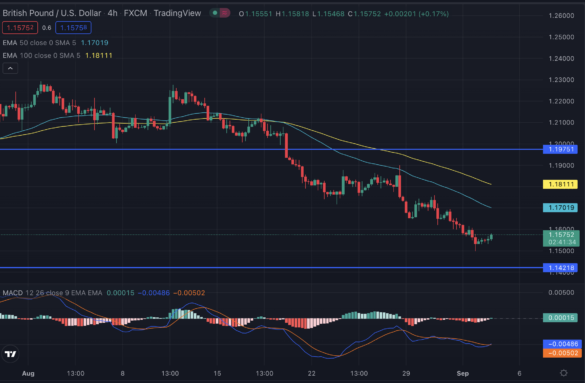
- Ever since the 50-Day Exponential Moving Average converged and crossed the 100-Day EMA there has been a negative price action in Cable. There is not much support for holding GBP/USD until the support is at 1.1421. Fundamentally users have to look at the data coming out of The Fed to forecast movements in GBP/USD.
- The hawkish tone has been present since the Jackson Hole Symposium and it reflects in the falling GBP/USD pair. It is to be noted if Jerome Powell continues this aggressive narrative then users can expect GBP/USD to test the support at 1.14 in the near term.
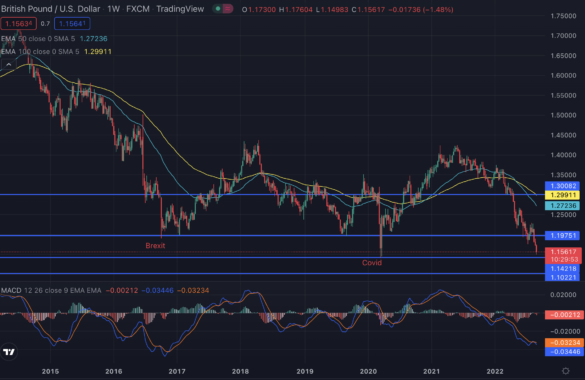
For GBPs long term outlook, the last 2 times it broke beneath 1.2 was during the volatility following Brexit and at the beginning of Covid.
March 2020 saw a decline in GBP/USD to 1.1421 which was the first time it hit those levels since the 1980s. It was not due to GBP weakness but instead it was due to USD strength as the Reagan administration introduced major tax cuts to boost the US economy
A quick look back at the price action of cable during the 1980s shows strong support levels formed at 1.102 and 1.05 which can be mostly due to the psychological influence these prices may have on investors.
If the Dollar continues its bull run then we may see price action fall to these levels.
WTI OIL BREAKDOWN
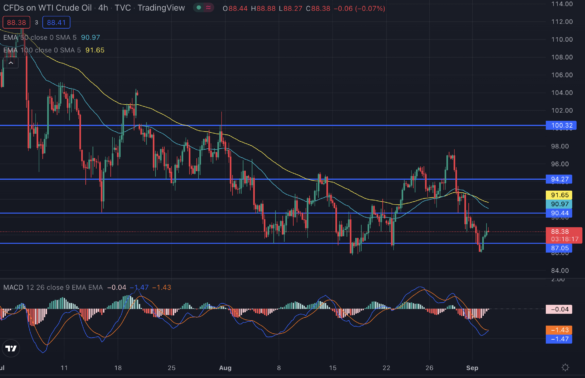
Crude bounced off the support at $86 as we see a slight indication of an incoming reversal. MACD signals a convergence approaching. The 50-day EMA encountered the 100-day EMA however due to weak volume, failed to continue that strength to the upside. We are seeing the anticipation trade in motion as traders await the cartels meeting on the 5th of September.
OPEC has signalled they will be cutting production to offset any major decline in crude prices. Saudi Arabia has given off the narrative that will slow production which sparked a rally in CL at the start of the week, however, that rally was short-lived and followed by a significant retracement to the downside. The cartel is already producing below their quota so traders are now awaiting more details on how they will carry out production costs.
ETHEREUM BREAKDOWN
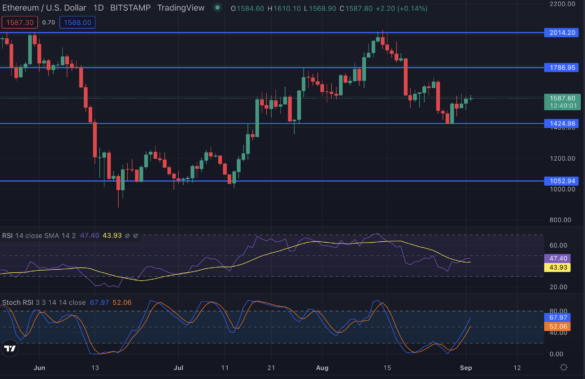
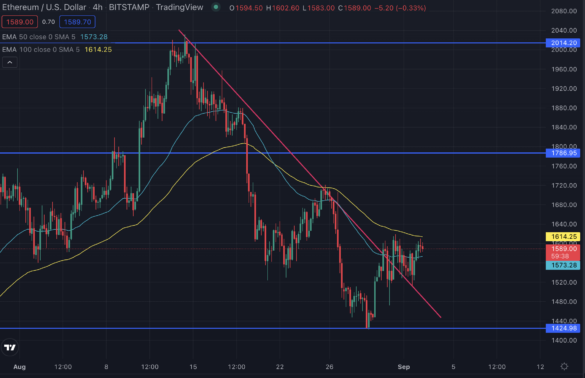
Major support and resistance levels for Ethereum can be expected upon the approach of The Merge
S1: $1424 ,S2: $1052, R1: $1786, R2: $2014
Traders should look out for these areas if they choose to set orders as this key levels have shown significant responses historically. RSI is sitting at 47.40 on the Daily which is quite non directional. Long term we are in a downtrend after a massive rejection at $2014.
The Fed and The Merge are the major influencers for price action in Eth prices at the moment, keep a close eye on both
Ethereum has been on a bearish downtrend since the 14th of August. We saw a slight break out of the downward trend line over the past couple of days.
Expect consolidation in Eth prices as we approach the consensus layer upgrade dubbed “Bellatrix” set for the 6th of September. Short term expect Ethereum to range between support at $1424 and resistance at $1786
BITCOIN BREAKDOWN
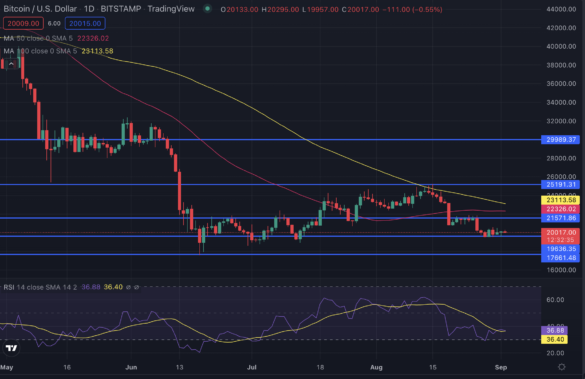
Bitcoin is correlating with stocks at the minute and is beginning to show responsiveness similar to that of high-risk tech assets. So expect downward momentum when there is uncertainty in the market. If The Fed sticks to their narrative and doesn’t become too hawkish unexpectedly then we may see consolidation with the range that it has been developing.
We see the 50-day MA begin to move horizontally towards the 100 day MA. This is a bullish movement and signals a reversal in the asset. If to 50 day Moving Average manages to cross the 100 day Moving Average this could indicate that price action may begin to see upwards movement. RSI is extremely oversold on the Daily chart and is currently at 36.40. Technically we are getting reversal signals in Bitcoin, however fundamentally with Inflation so high and the aggressive monetary policy coming out of the Fed, we can’t expect any major bullish price action in the short term to medium term.
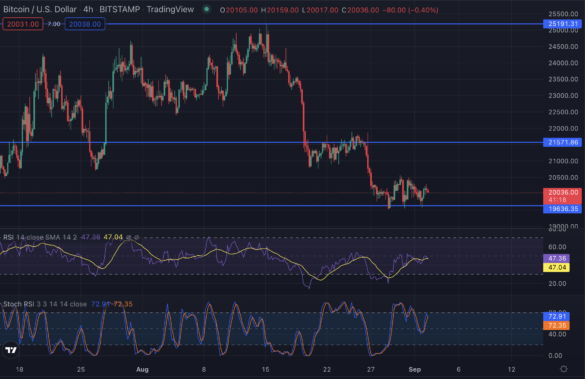
Bitcoin has settled around the support level at $19636. This is a slight short squeeze pattern which has been formed in the 4 hours and we can expect a beak to the downside as more selling momentum builds and volume enters the market. If the news release is negative it will have an effect on Bitcoin short term and we could expect a fall beneath the support level we see here.
If we see positive news then expect upward price action to the next resistance level at $21571
Crypto products are unregulated and could be highly volatile. Please be aware of the risks before investing.
DIFX shall not be responsible for any loss arising from any investment based on any recommendation, forecast or other information herein contained. The contents of this publication should not be construed as an express or implied promise, guarantee, or implication by DIFX that the forecast information will eventuate, that clients will profit from the strategies herein or that losses in connection therewith can or will be limited. Trades in accordance with the recommendations in an analysis, especially leveraged investments such as foreign exchange trading and investment in derivatives, can be very speculative and may result in losses in particular if the conditions or assumptions used for the forecast or mentioned in the analysis do not eventuate as anticipated and the forecast is not realized.
