Ethereum, the second-largest cryptocurrency by market cap, is a favorite amongst a large portion of crypto holders. With the overall crypto market eyeing out a new bull run, we decided it was time to do a check-up on how the protocol is operating in terms of liquidity, the value of staked Eth, and the Ethereum NFT market while providing a general overview of the protocol.
The data has been taken from a reputable dashboard on Dune Analytics where users can fetch on-chain data directly from the Ethereum chain.
Overview
Transactions
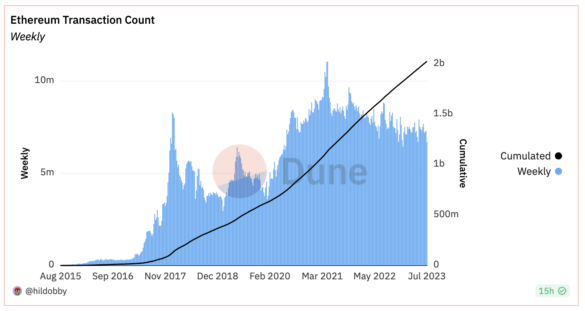
The transaction count for Ethereum has seen a steady increase and has now hurdled above the $2b mark. If we take a closer look at the weekly transaction count chart, we can see that since 2021, there was a decline in weekly transactions. This correlates with the bear market that started late that year.
We began to get lower readings consistently up until December 2022 which is also the same time the market began to see some bullish sentiment. The lowest weekly count was $6.4m which occurred over the week beginning 26/12/2022. Since then, the weekly count has consolidated, signaling that the market is beginning to rebound upwards.
Users
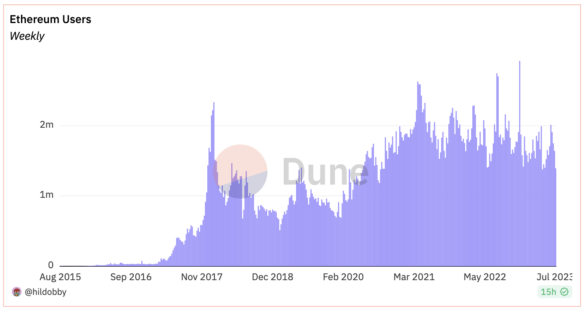
The Weekly Average Users are any active addresses on the Ethereum chain. Considering the bear market, activity on the network stayed relatively high which is a signal of continued growth and development in the space.
In 2021, we had a high of around 2.6m Weekly Average Users and in early June of this year, we had a WAU of just over 2m. This indicates that even with a massive fall in price, we are still seeing adoption and growth within the actual ecosystem.
Smart Contracts Creation
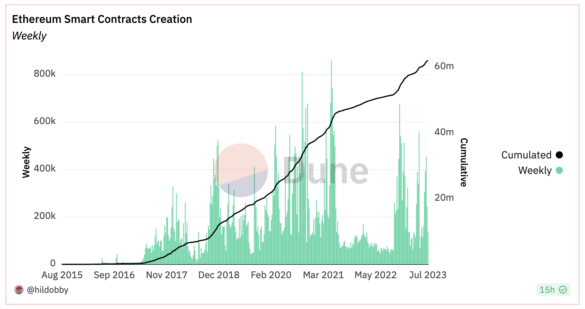
Ethereum Smart Contracts come in all types and forms but on a high-level understanding, they are any program or application that has been deployed onto the Ethereum blockchain which users can then interact with.
Their creation saw stagnation through the 2022 bear market which is reasonable. However, we still saw a weekly average reach as high as 170k in early 2022 which is near the figures we saw multiple times throughout the 2021 bull market. Since late 2022, we have seen smart contracts created at a much faster pace, confirming that developers and creators are deploying programs on the Ethereum network.
Ethereum Staking
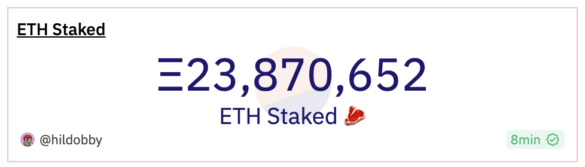
ETH Staked
At the current price of Ether around $1893, the value of the ETH staked is $45 billion. We can use this to calculate the Total Value Locked Ratio or TVL Ratio.
Please note at the time of writing, the market cap was $228 billion.
TVL Ratio = Market cap / Total Value Locked $228b / $45b = TVL Ratio of 5
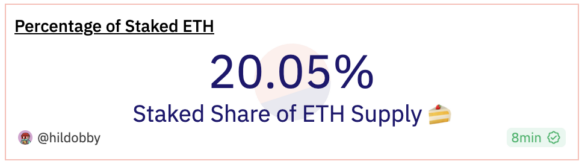
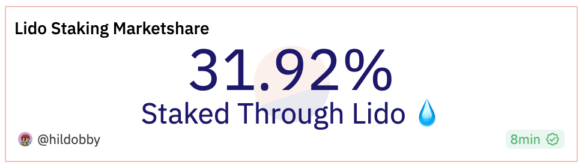
20% of the total supply of Eth is staked which reassures investors that the network is solid and liquid. There is no layer 1 that can be compared to Ethereum in terms of volume, users, and value. Lido is the ultimate leader for Eth staking with nearly a third of all ETH staked on the platform.
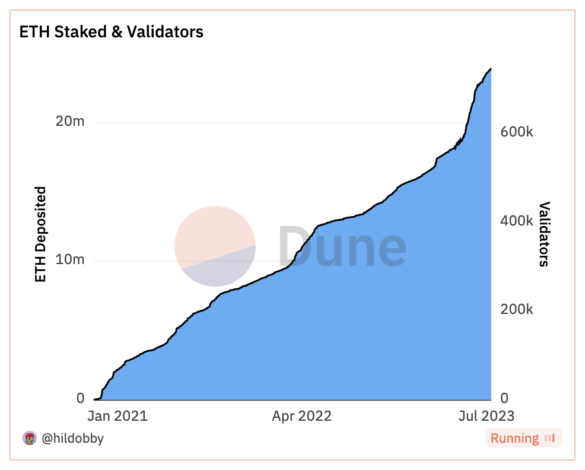
ETH Deposits & Validators
Below, we see a chart of ETH Deposits and ETH validators. It is interesting that from April 2022 to July 2023, we have seen the amount of ETH staked double in value, even though this period consisted of a pure bear market. Inventors should be curious as to how this figure will look if we had to embark on the widely predicted bull run which is forecast to start toward the end of 2023.
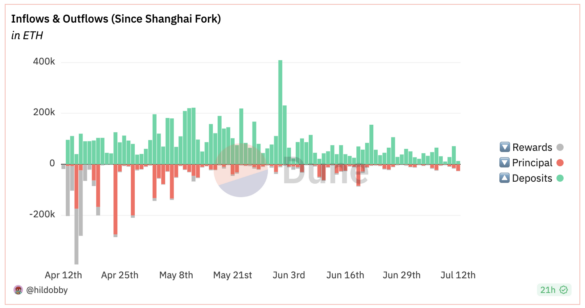
ETH Inflows & Outflows
As we can see from the chart above, daily inflows have outperformed outflows on the Ethereum protocol since the Shanghai Fork. The volume of deposits has slowed down since the peak of 400k Eth deposited on the 1st of June 2023. At the same time, the volume of outflows has decreased by a similar ratio.
On July 11th, 2023, ETH inflow totaled 71,000 ETH, and outflow totaled 14,000 ETH which means ETH inflow accounts for 5x that of outflows on the most recent data point.
Ethereum NFT Market
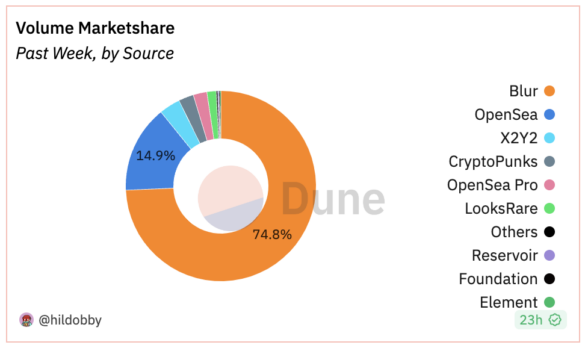
Market Overview
Since the launch of Blur, there has been a dramatic shift in the NFT market toward a more trading environment. This has led to a decrease in the market share for OpenSea. It has also contributed to a fall in the overall value of NFTs since the ecosystem is targeting traders and not actual utility or value for the NFT project and the ecosystem as a whole. Creators and Artists have suffered with a fall in the royalties which was the ultimate incentive for stakeholders in the space.
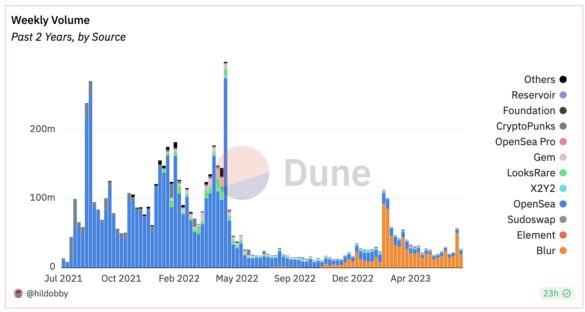
Volume
Weekly
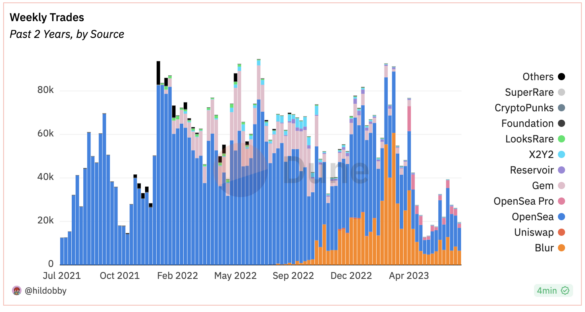
Over the past 2 years, OpenSea was clearly the dominant force in the Ethereum NFT market. Weekly volume reached as high as $200m on 3 occasions which is an astronomical figure. Since late 2022, we see how quickly Blur consumed that market share with OpenSea’s control over the market evaporating.
The overall weekly volume has begun to pick up in 2023 after reaching lows during Q1 2022. The NFT industry as a whole has suffered and there would need to be a change in the mechanical structure of these platforms for the industry to return to the same previous amount.
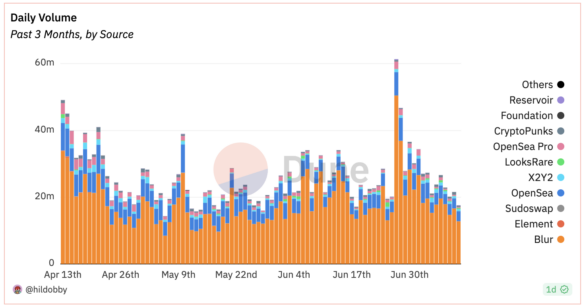
Daily
Below is a closer look at the daily volumes over the past 3 months. Towards the end of June, there was a peak of $60m daily volume which is considerable during a consolidation cycle in the crypto market. Volumes have been quite flat since last April, with no clear upward or downward trend.
Transactions
Weekly
The following chart shows the number of weekly trades on Ethereum’s NFT network. It is interesting to note that even though it’s clear that Volume decreased exponentially from May 2022, the number of weekly transactions did not see the same ratio of decline.
This displays that even though trades were still averaging between 40k and 80k a week, the volume of these transactions had fallen drastically. We can also say that since Blur began to take the majority of the market share, a fall in total weekly trades started. This aligns with our previous analysis of the structural change in the NFT industry with the introduction of Blur and more trading-based NFT platforms.
Daily
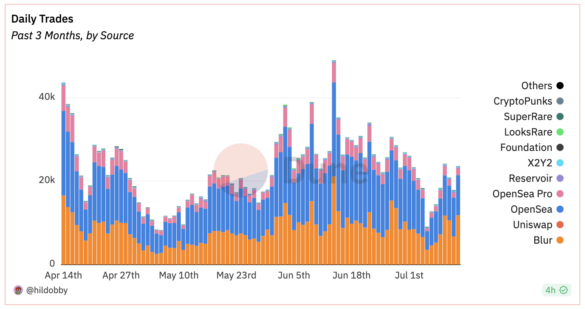
By viewing the daily transactions in the past 3 months, we can see a slight dip in the trade count leading up to early May. It’s worth mentioning that with a closer look, OpenSea market share has not necessarily continued to decline. It has held its position for the past 3 months in terms of transactions.
The daily trades ranging between 20k – 40k don’t count as a total capitulation in the market as many media outlets have announced. It is fair to say that there is still a decent level of activity in the Ethereum NFT market.
Note: The data presented in this report is curated from Dune Analytics, specifically from the user hildobby: https://dune.com/hildobby.
Disclaimer:
This material is for informational purposes only and is only intended for sophisticated or institutional investors. DIFX shall not be responsible for any loss arising from any investment based on any recommendation, forecast, or other information herein contained. The contents of this publication should not be construed as an express or implied promise, guarantee, or implication by DIFX for any activities you as the user might do as it is strictly only for informational purposes. Trading is a highly risky activity and must only be done with proper knowledge and research.